Why Meta Platforms Stock Can Hit $400 (NASDAQ:FB)
Written by Lucky Wilson | KGTO Writer on April 7, 2022
Fritz Jorgensen/iStock Editorial via Getty Images
Meta Platforms (NASDAQ:FB) is likely one of the best opportunities in the market for investors with a long-term time horizon. We believe the market is mispricing the stock in a big way, and that the panic investors showed after the last earnings report was a big overreaction. Indeed, we will demonstrate how the market is pricing the company well below its own expectations. As a result, we are bullish on the stock.
Industry Overview
Meta operates in the digital marketing industry, which is expected to grow at a CAGR of 17.6% between 2021 and 2026. Its main American competitors include Pinterest (PINS), Snap (SNAP), Twitter (TWTR), and YouTube (GOOG) (GOOGL). However, its biggest threat at the moment is TikTok (BDNCE). Users in the U.S. spend an average of 38 minutes per day on TikTok versus the 31 minutes and 29 minutes spent on Facebook and Instagram, respectively.
eMarketer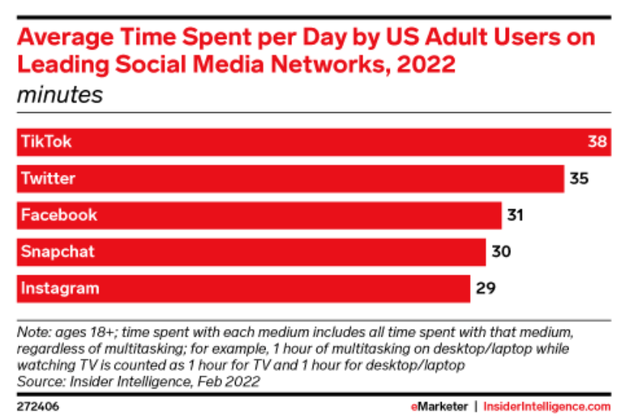
As you can see from the picture above, Twitter is also ahead in engagement while Snapchat is essentially in line with Meta. In the most recent earnings report, Meta disclosed that it lost users for the first time, witnessing a decline of 500,000 users. Meanwhile, TikTok grew from 700 million to 1 billion and is expected to add another 500 million in 2022.
Although many saw this as something troubling, we view it as an opportunity to buy a great business at a low price because Meta is still the undisputed king of monetization:
Revenue in millions USD (Image created by the author)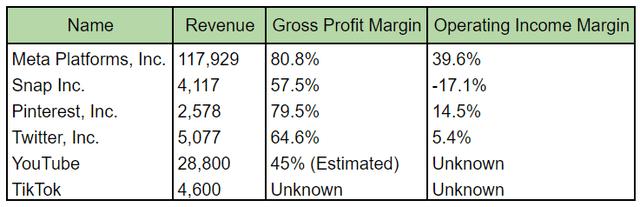
As we can see from the chart above, Meta generates more revenue than all the companies in this comparison combined, with TikTok’s revenue not even coming close. In addition, gross profit margins are stellar at 80.8%, with Pinterest being the only one that comes close at 79.5%, and YouTube being far behind at an estimated 45% on $28.8 billion of revenue. We arrived at this figure because YouTube takes a 45% cut of the ad revenue generated by content creators.
Furthermore, its operating margin is significantly higher as well and likely to be much higher than that YouTube considering that it’s almost the same as the estimated gross margin. Nevertheless, YouTube’s parent company Alphabet has an operating margin of 30.6%, still lower than Meta.
However, there are some concerning trends investors need to pay attention to. Below are screenshots of the website traffic from the main social media platforms:
Meta Website Traffic (TipRanks) YouTube Website Traffic (TipRanks) Twitter Website Traffic (TipRanks) Snap Website Traffic (TipRanks) Pinterest Website Traffic (TipRanks)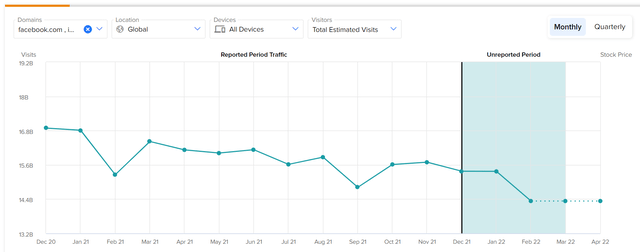
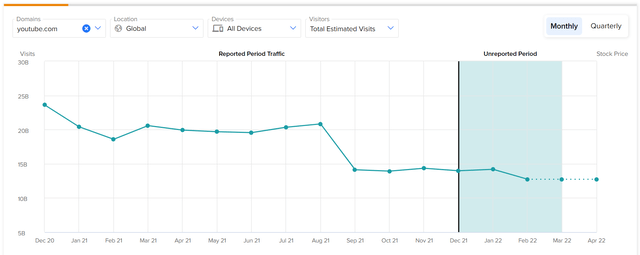
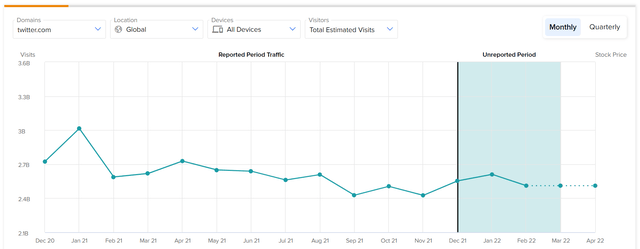
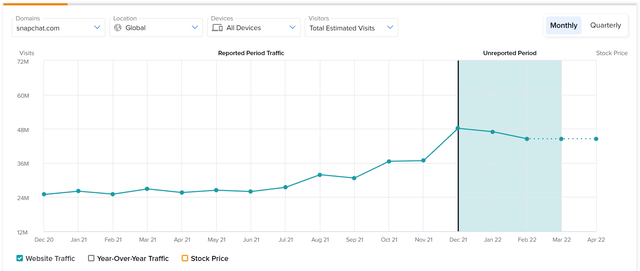
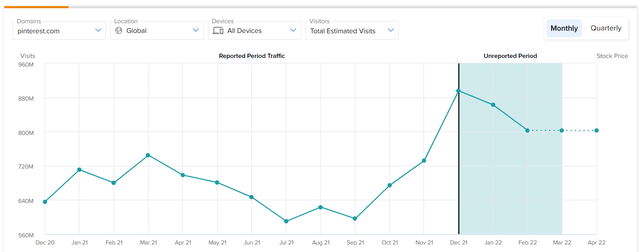
The number of website visits across all of Meta’s platforms collectively have trended downwards since December 2020. Although a similar trend appears for YouTube and Twitter, Snap and Pinterest have actually seen website traffic tick up recently. Therefore, this is something investors should monitor going forward to see if management at Meta can reverse the trend or at the very least keep it flat.
Meta Has a Huge Competitive Advantage
Besides the obvious factors such as Meta’s size and user base, we want to demonstrate quantitatively just how strong the company’s competitive advantage truly is.
To measure Meta’s competitive advantage, we will employ a method called earnings power value, which was created by Bruce Greenwald. Earnings power value is measured as adjusted earnings, divided by the weighted average cost of capital, and reproduction value can be measured using total asset value. The idea is simple: assuming no growth, if a company can generate more value from earnings relative to the total asset value, then that company is considered to have a competitive advantage.
Although the formula is simple and straightforward, there are quite a few steps required to calculate adjusted EBIT after tax. First off, we will need to compute the average EBIT margin of the past five years, which in this case is 0.426 (42.6%).
The next step is to normalize the EBIT and calculate the net operating profit after tax or NOPAT.
Please note that all calculations are in millions of dollars:
- NOPAT = LTM Revenue x Average EBIT Margin x (1 – Tax Rate)
- $41,184.8 = $117,900 x 0.426 x (1 – 0.18)
Now that we have NOPAT, we need to adjust depreciation and capex to account for the assumption of no growth because less investment would be required:
- Adjusted Depreciation = (0.5 x Tax Rate) x Five-Year Average Depreciation
- $502.4 = (0.5 * 0.18) x $5,582
Next, we will need to calculate the maintenance capex of for each of the past five years and then find the average:
- Maintenance Capex = Total Capex x (1 – Revenue Growth Rate)
Using the formula above for each of the past five years, we arrive at an average maintenance capex of $9,373.5.
Now that we have both adjusted depreciation and average maintenance capex, we can calculate the adjusted earnings and EPV as follows:
- Adjusted Earnings = NOPAT + Adjusted Depreciation – Average Maintenance Capex
- $32,313.7 = $41,184.8 + $502.4 – $9,373.5
- EPV = Adjusted Earnings / Weighted Average Cost of Capital
- $430,849 = $32,313.7 / 0.075
Note: WACC was taken from Finbox.
Since Meta has a total asset value of $166,000 (in millions), we can say that it does have a competitive advantage. In other words, assuming no growth for Meta, it would require $166,000 of assets to generate $430,849 in value over time.
The benefit of this method is that it allows investors to actually quantify a company’s competitive advantage in an easy-to-understand way. This reduces the need for investors to qualitatively try figuring out what makes a company better than others, a process prone to human error and misinterpretation of information. The idea is that the qualitative factors should be reflected in the numbers, otherwise, a company is more prone to overpromising and underdelivering.
The drawback to this method is that it assumes no growth, thus eliminating many growth stocks that might have legitimate competitive advantages but have chosen to reinvest money into capturing more market share.
Thus, this type of analysis is best suited for mature companies that are more focused on profitability. However, if you do find a growth stock with profitability and an earnings power value that exceeds total asset value, then it is likely to be a strong performer.
FB Stock Valuation
To prove just how undervalued Meta truly is, we have reverse-engineered a discounted cash flow analysis to determine the required growth rate to justify its current share price of $223 at the time of this writing. The results were as follows:
Image created by the author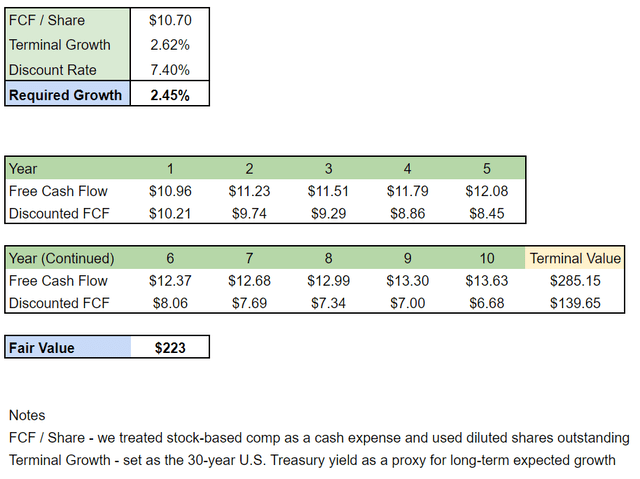
As we can see, the market is pricing in only a 2.45% CAGR in free cash flow growth over the next 10 years. Interestingly, when we look at the market’s own expectations in the form of analysts’ consensus, we can see that expectations are for double-digit growth over the next five years:
Simply Wall St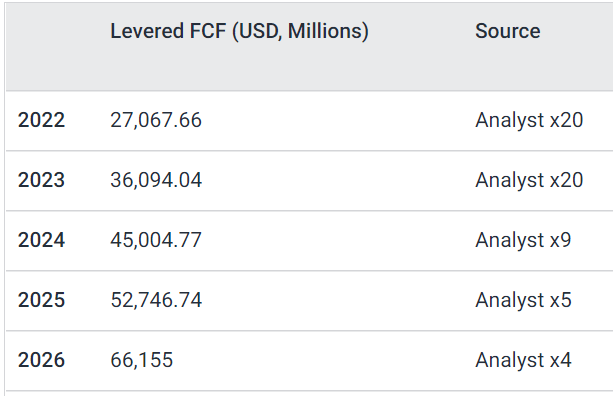
With the LTM free cash flow of $39.116 billion, the CAGR over the next five years is as follows:
(66.115 / 39.116) ^ (1/5) – 1 = 0.1107 or 11.07%
Below is a picture of Meta’s valuation at different growth rates:
Image created by the author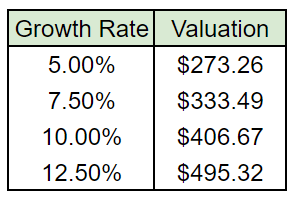
It seems very unlikely to us that FB will only grow FCF at 2.45%, and we believe double-digit growth is likely to be sustained at least for another 10 years. Therefore we believe the stock can easily hit $400 at some point in the future.
Risks
As already mentioned, TikTok appears to be a big risk for Meta, as the app continues to grow in popularity. This is especially true when it comes to teenagers, as they tend to prefer TikTok over Instagram:
Forrester Research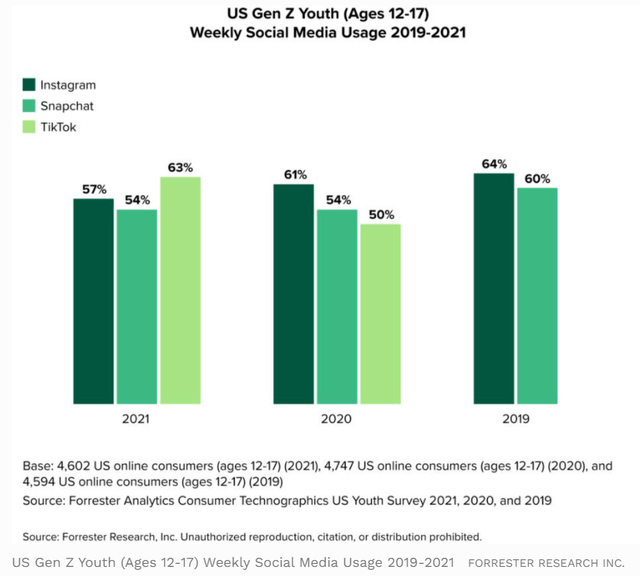
As we can see from the picture above, Instagram usage has been declining among teens in the U.S. over the past few years as TikTok has seen usage increase. The reason for this is that teenagers view TikTok as funnier and more positive than other social media platforms.
Furthermore, it’s also worth mentioning that YouTube is actually the most popular platform among teens with 72% of them using it weekly. Thus, Meta needs to improve its appeal to younger generations if it wants to sustain its dominance for many more decades to come.
Another potential risk is the continuous flow of controversy that plagues the company. Just when you think you’ve heard enough negativity come out of the company, reports surface that Meta has launched a smear campaign against TikTok.
This isn’t the first the company has resorted to this tactic, as it attempted something similar in 2011 against Google. As a result, Meta really needs to figure out how to stay out of negative headlines the way most of its competitors have figured out how to do so.
Nonetheless, TikTok’s rise and the controversy haven’t prevented the company from continuing to grow revenue over the years at a rapid pace, and we expect Meta to continue growing despite the competition and negativity.
Growth Catalyst
The main growth catalyst for the stock is simply the ridiculously low valuation that the market has currently assigned. Yes, interest rates are climbing and Meta is expected to see a decline in free cash flow in 2022 as demonstrated in the analyst forecast in the valuation section.
However, Meta still prints money while maintaining impressive margins and the free cash flow is still expected to return to growth starting in 2023. Therefore, the market will eventually push the stock towards fair value.
In addition, Meta will focus more on Instagram Reels going forward in order to take on TikTok more effectively. Whether this strategy will work remains to be seen, but it demonstrates that management is aware of the problem and is actively seeking a solution instead of resting on their laurels.
Final Thoughts
Despite all the controversy and competition, Meta will likely continue to perform well going forward. In addition, the current valuation implies only 2.45% growth in free cash flow which is well below the market’s own expectations. As a result, we are bullish on Meta.
Source link